Convolution

Prof. Richard B. Goldstein

Return to Statistics

There are two versions showing the convolution of
S = X1 + X2 + ... + Xk
where the Xi are identically distributed random variables.

If we set color="red" and f(x) = Math.abs(x) with x in [a,b] = [-1,1], then we get the following picture:
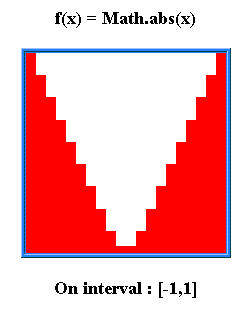
conv1
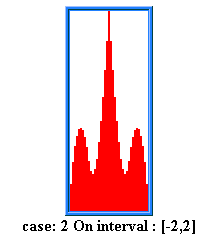
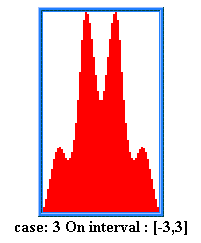
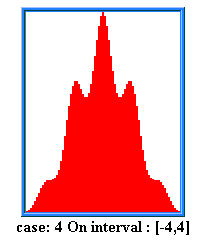
of X1 alone. The following pictures show the sum for k =2, 3, and 4:
conv2conv3conv4
Options:
  1. Single picture of pixel size 401 x 401 of the sum of k variables where k can range from 1 to 50.
  2. All of the pictures of pixel size 201 x 201 from cases 2 to k where k can be up to 20.

Note: The pictures may be printed from Internet Explorer 9.0. On any browser one can use the "Print Screen" key to capture the picture on the clipboard and then use the Windows accessory package Paint or a similar package to cut the picture you want to save or print.